Despite being found in many skin care formulas, vitamin B isn’t discussed as frequently as some other vitamins, but it should be. Read on to discover what the ingredient can do for your skin.
In terms of skin care, there are four major vitamins of which you ought to be aware. You’re probably already well acquainted with vitamin C (a complexion brightening powerhouse) and vitamin A (also known as retinol). You may even be familiar with vitamin E, which helps soothe and heal the skin. The last, and perhaps most underrated one, is vitamin B.
Vitamin B boasts a plethora of skin care benefits when applied topically or when ingested as supplement. There are even vitamin B booster shots that have become quite popular in medspas and clinics.
Today, with dermatologist insight, we’re schooling you on what vitamin B is, which skin types benefit most from using it, and how you can swiftly incorporate it into your regimen.
Meet the Vitamin B Family
Out of all the vitamins found in skin care, vitamin B may be the most intimidating due to how many different types exist. What you need to know is that there are three primary forms: vitamin B3 (also known as niacin), vitamin B5 (also known as panthenol), and vitamin B12.
“Vitamin B3 has been shown to boost collagen production and also reduce dark spots. Niacinamide, a derivative of vitamin B3, has been shown to improve the ability of the epidermis, the upper most layer of the skin, to retain moisture. Niacinamide can also serve as an effective skin-lightening agent when added to moisturizers,” explains Dr. Hadley King, a board-certified dermatologist based in New York City. “Vitamin B5 is used as a humectant and is highly popular in moisturizers, shampoos and hair conditioners, offering barrier conditioning effects on the skin.”
RELATED: Your Scalp Is the One Area of Your Skin You’re Probably Not Paying Enough Attention To
Vitamin B12, when applied topically, has been shown to successfully treat eczema by reducing the body’s production of nitric oxide production. It’s also an important vitamin that we get from our diets or in supplements. Those who cannot readily absorb vitamin B12 from the GI tract could benefit from a B12 injection, notes Dr. King. For most people, though, oral supplements are adequate.
The Skin Benefits of Vitamin B
In general, B vitamins are rock star ingredients in skin care. This is because they’re stable — meaning they don’t “sour” in the container very easily and therefore keep for longer — and because the skin happily and easily drinks them up. They’re also rich in antioxidants, which helps keep the skin protected from free radicals and therefore more youthful looking.
“These properties make topical vitamin B products well suited for face creams, particularly for dry skin, and also for body creams, particularly for dry or eczema-prone skin,” notes Dr. King.
While topical skin care is wonderful, taking an oral B-complex supplement (or getting regular injections) is very important if you’re deficient in B vitamins, adds Dr. Audrey Kunin, a board-certified dermatologist and the founder of DERMAdoctor.
“Vitamin B is vital for general good health,” she says. “A lack of it in our diet can lead to the disease pellegra which involves an eczema-like rash, oral sores, diarrhea and dermatitis.”
RELATED: Should You Be Taking Supplements for Your Skin?
Where to Find It
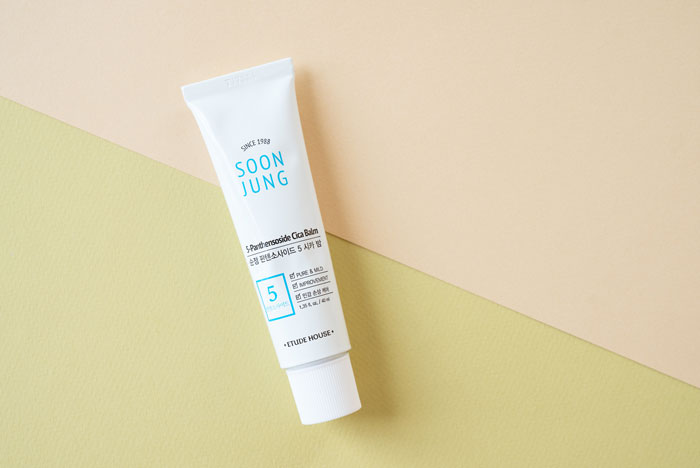
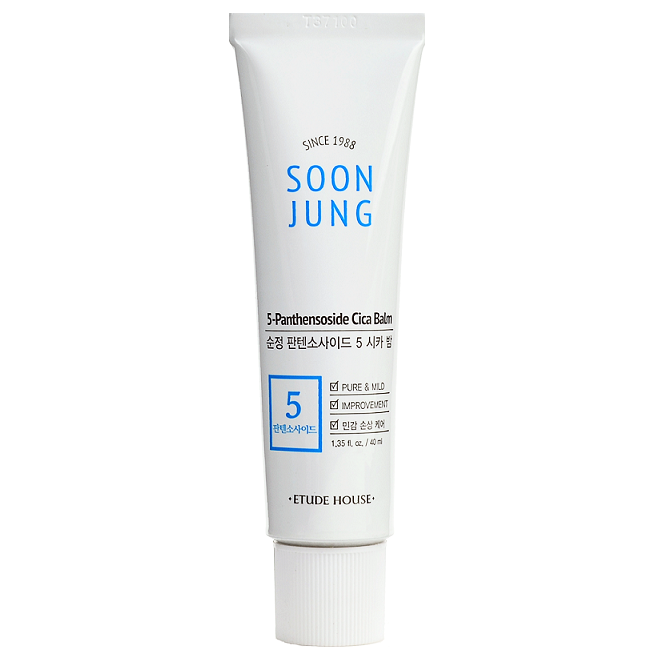
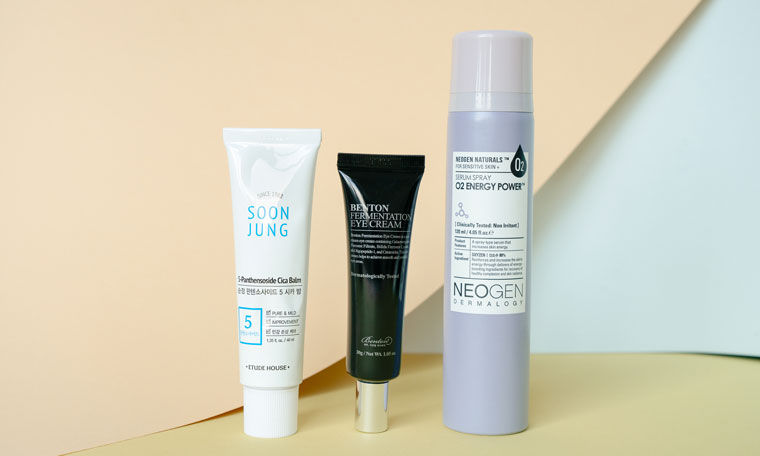
One of our favorite vitamin B-rich products is the Etude House SoonJung Cica Balm-Panthensoside 5 ($20), which features vitamin B5 to seriously hydrate and nourish the skin. It also contains centella asiatica (cica), a particularly trendy ingredient in skin care right now that helps soothe inflamed, tired, and sensitive skin.
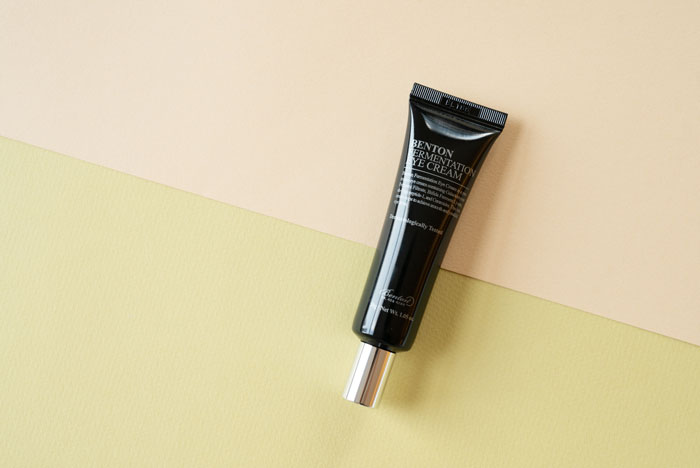
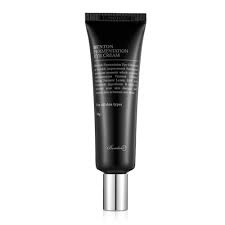
For another vitamin B5-infused product, try Benton’s Fermentation Eye Cream ($27). This highly reviewed favorite combines hydrating vitamin B5 with skin-strengthening ceramide NP, soothing aloe vera, plumping hyaluronic acid, and a powerful fermented duo of galactomyces ferment filtrate and bifida ferment lysate. The end result is a product that works in real time while helping correct over the long term.

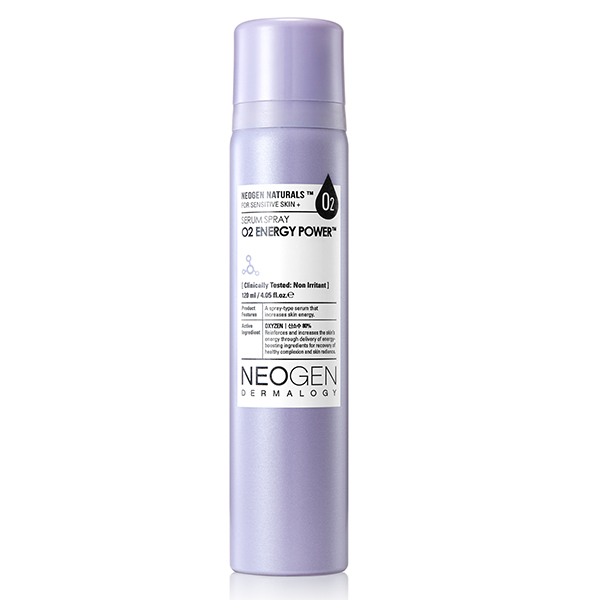
Finally, we want to highlight Neogen’s 02 Energy Power Serum Spray ($19), which contains vitamin B3 (niacinamide) to brighten your complexion and protect the skin. It also contains 80% oxygenated water to reinvigorate, nourishing seaweed extract, and hyaluronic acid. Use it as a pick-me-up mist during the day, or simply incorporate it into your morning and evening skin care regimen.
Bottom Line
Vitamin B is a key ingredient when it comes to maintaining and improving your skin health. It especially excels in brightening, conditioning, and treating issues like eczema, dermatitis, and dryness.