The last year, although incredibly challenging, has forced us to persevere and grow. This author took her time stuck inside and turned it into a self-love experiment that included a bare face, a revamped skin care routine, and newfound self confidence.
The year 2020 was a tough one to say the least. But there are a few good things that came out of it. One being that it forced a lot of us to slow down and make time for rest and self-care. That self-care, in turn, helped us foster more self-love.
A few months into the pandemic, I realized that wearing a face mask with any degree of makeup on, even if it was the usual tinted moisturizer or the teeny tiny bit of concealer I used to hide occasional blemishes, was by no means worth it anymore. It would only clog my pores and trigger breakouts. Once the summer hit I decided to go all Alicia Keys sans makeup and it was the best thing that’s ever happened to my skin AND to my self-esteem.
I’ve never been a big makeup girl to begin with. Since college, the French-girl minimalist look had always been my vibe. Little to no makeup, a layer of mascara to bring out my naturally long lashes, pencil liner on my lower lid and a nude lipstick was my look for years. That was until I became a beauty reporter and felt the pressure to start using foundation, rock winged liner, and wear bright and bold lipsticks. Don’t get me wrong- there was nothing wrong with amping up my makeup look and I certainly wasn’t caking it on. But by the time I hit 30, I realized I was actually on to something during my college years. Less is more and the more natural I kept my look, the more beautiful I actually felt. However, my skin didn’t always lend itself to bare face looks.
Even though my beauty and style simplified after 30, my skin hadn’t gotten the memo and cleaned up its act. I would occasionally break out from hormonal acne on my chin/jaw area. Rosacea would show up on my cheeks in the brutal winter months and my skin overall just became more sensitive and prone to irritation. As a result, I always felt like I needed to have at least a tinted moisturizer on standby in case my skin needed some covering up.
When the pandemic hit, I was once again left reevaluating skin, beauty, and self care. My whole perspective on skin changed. After realizing that wearing any degree of makeup underneath my mask — especially during the summer months — was only going to lead to breakouts — I coughed up the courage to leave my house completely bare faced every single time I ventured outside. Within a week or so any maskne that had developed cleared up.
Relying on my bare skin also made me even more cautious of my skin care needs. If I thought I cared about skin care before, I was now on a whole new level. My complexion became something I poured all of my time and attention into. Within a few weeks my skin looked better than it even had in my 20s. It was bright, clearer, poreless, and more radiant than ever before. I didn’t just feel comfortable in my bare skin but I felt prettier than I did when I was using makeup. I met up with friends bare faced (following all the CDC guidelines of course), I took video calls and Zoom job interviews bare faced but would swipe on some mascara and add a nude lip so I wouldn’t look like I just rolled out of bed, and I celebrated family events barefaced (again with the exception of a swipe of mascara and a lip color). The only time I ever dabbed on some concealer under my eyes was for my IG Lives and a professional photo shoot — that’s it.
Turns out I’m not the only one who chose to forgo makeup last year. After the pandemic hit, quite a few women choose to wear less or no makeup at all. Many of us found ourselves adapting to a much simpler, much more natural and easygoing beauty routine. Even celebs started embracing the whole bare faced look, showing off their bare skin through sharing selfies on IG.
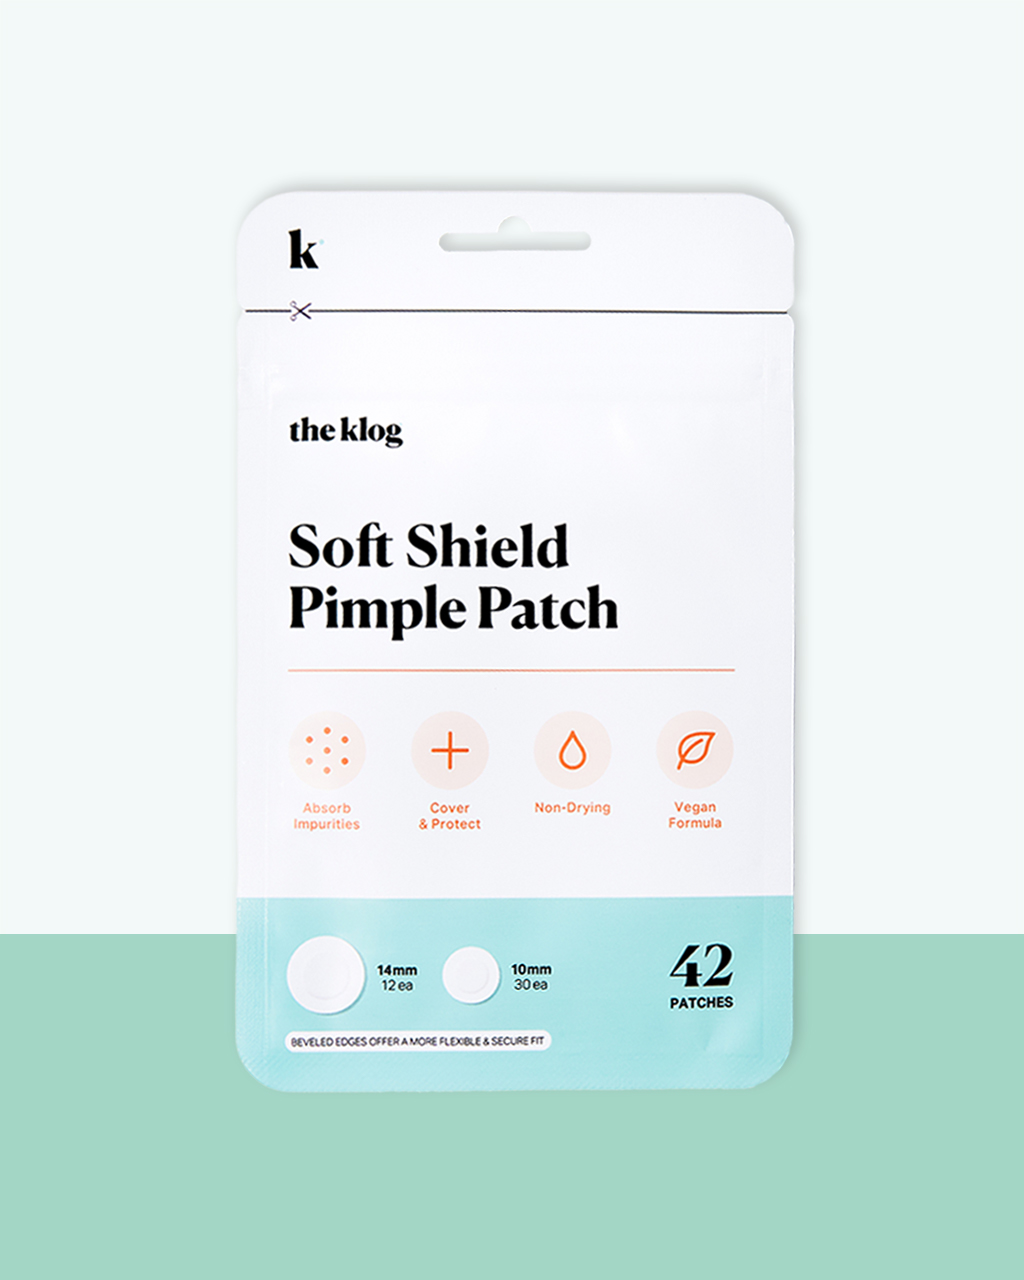
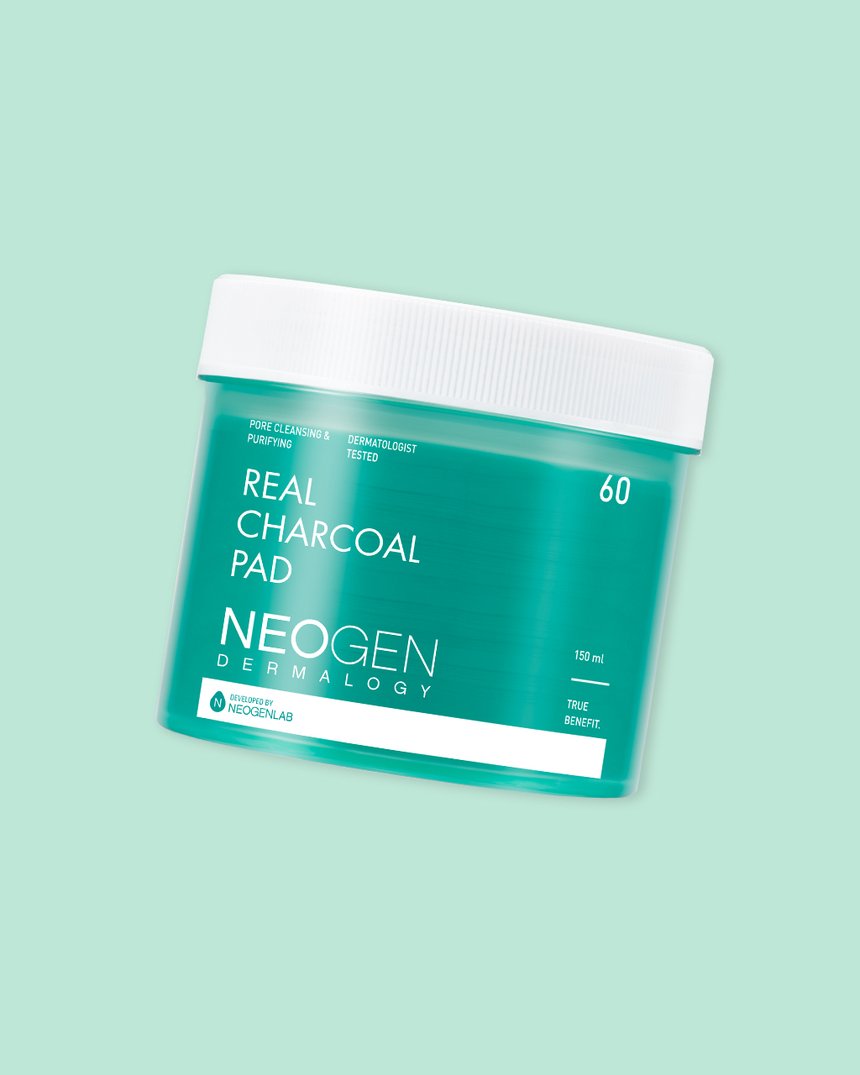
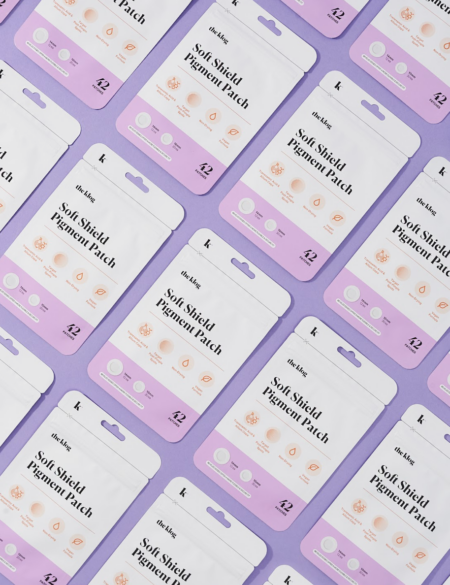
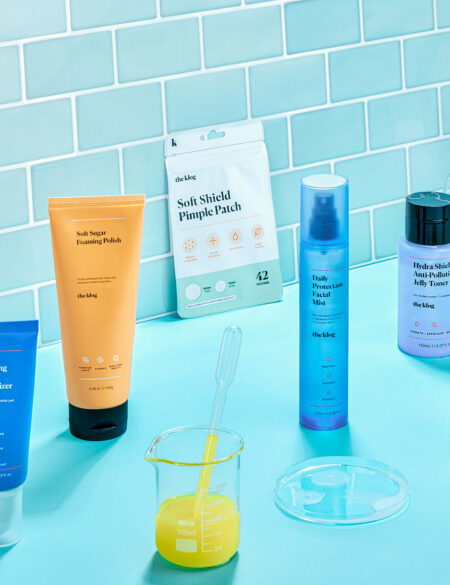
In a society that profits off of us believing that we’re not enough and convinces us that we need to cover every inch of our so-called imperfections, feeling comfortable and confident in my bare skin felt like such a relief. It took a pandemic for me to get there but I’m glad I did nonetheless. Trading in makeup for an even more dedicated skin care routine did wonders for me. The few times I would get a pimple, I felt less shame about it. And instead of covering it up with concealer, I’d cover it up with a pimple patch like The Klog Soft Shield Pimple Patch and used the Acropass Trouble Cure Patch on especially stubborn zits. If it was stubborn I’d swipe my detoxifying Neogen Real Charcoal Pad over the impacted area and pimples.
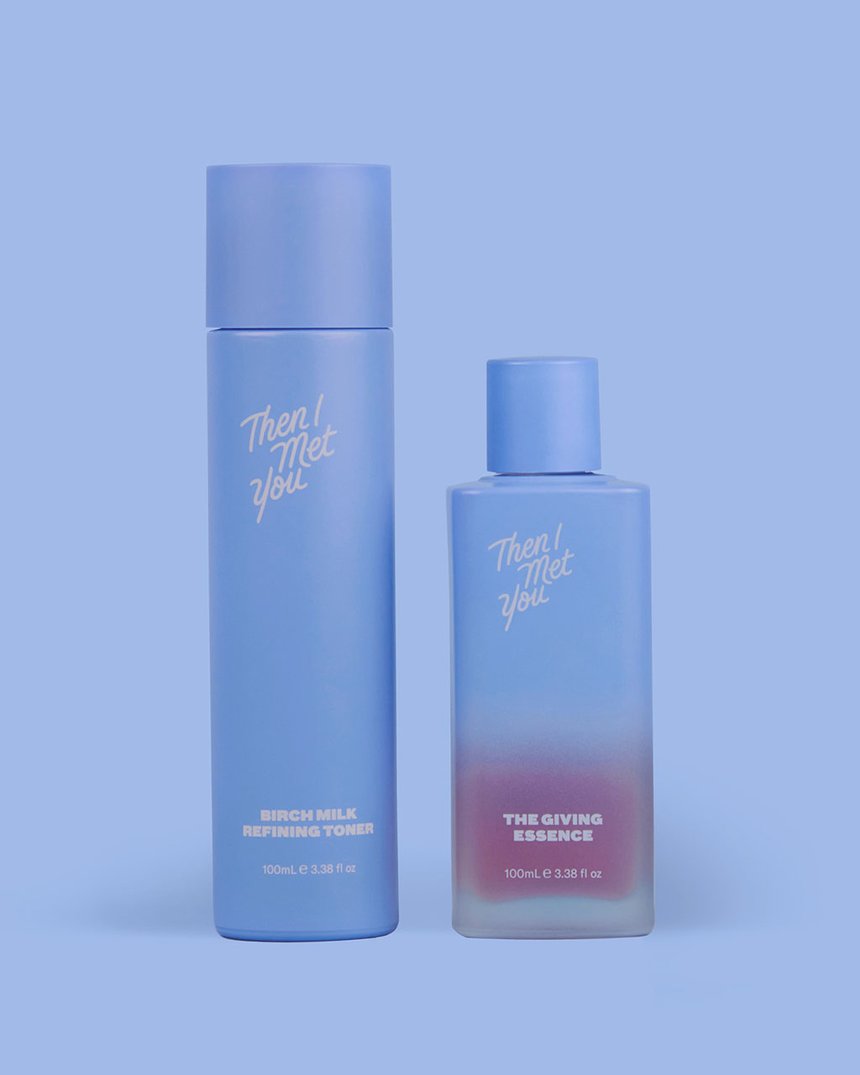
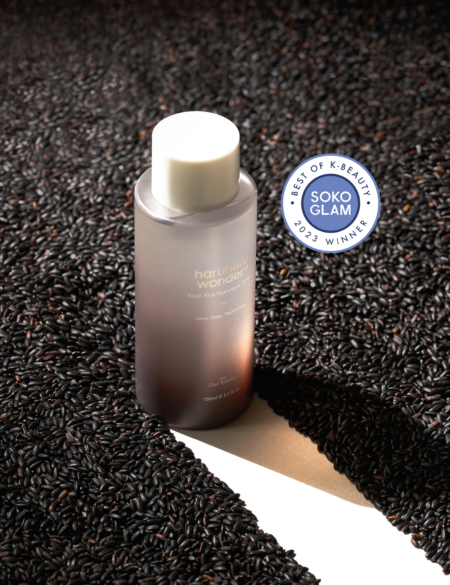
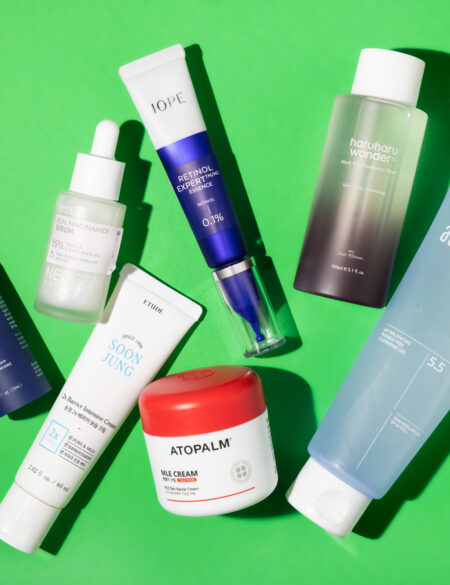
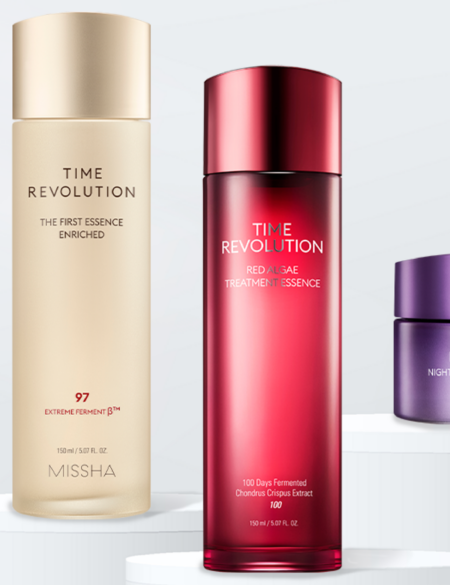
I continued double cleansing with gentle cleansers like the Hanskin Pore Cleansing Oil and the Dr. Oracle A-Thera Cleansing Foam every morning and night. They leave my combination skin clean and clear while keeping access oil at bay. I use a gentle but effective toner followed by a hydrating and watery essence like the Then I Met You The Skin Balancing Duo. Adding toner and essence back into my routine has actually made all the difference. It helps the face oil and moisturizer I use penetrate even more, leaving me with a glowy and smooth complexion.
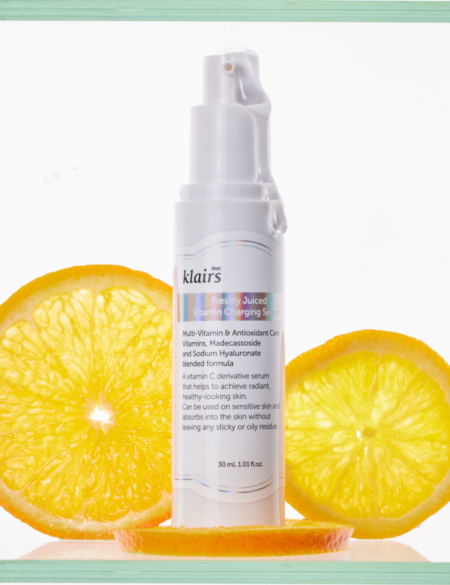
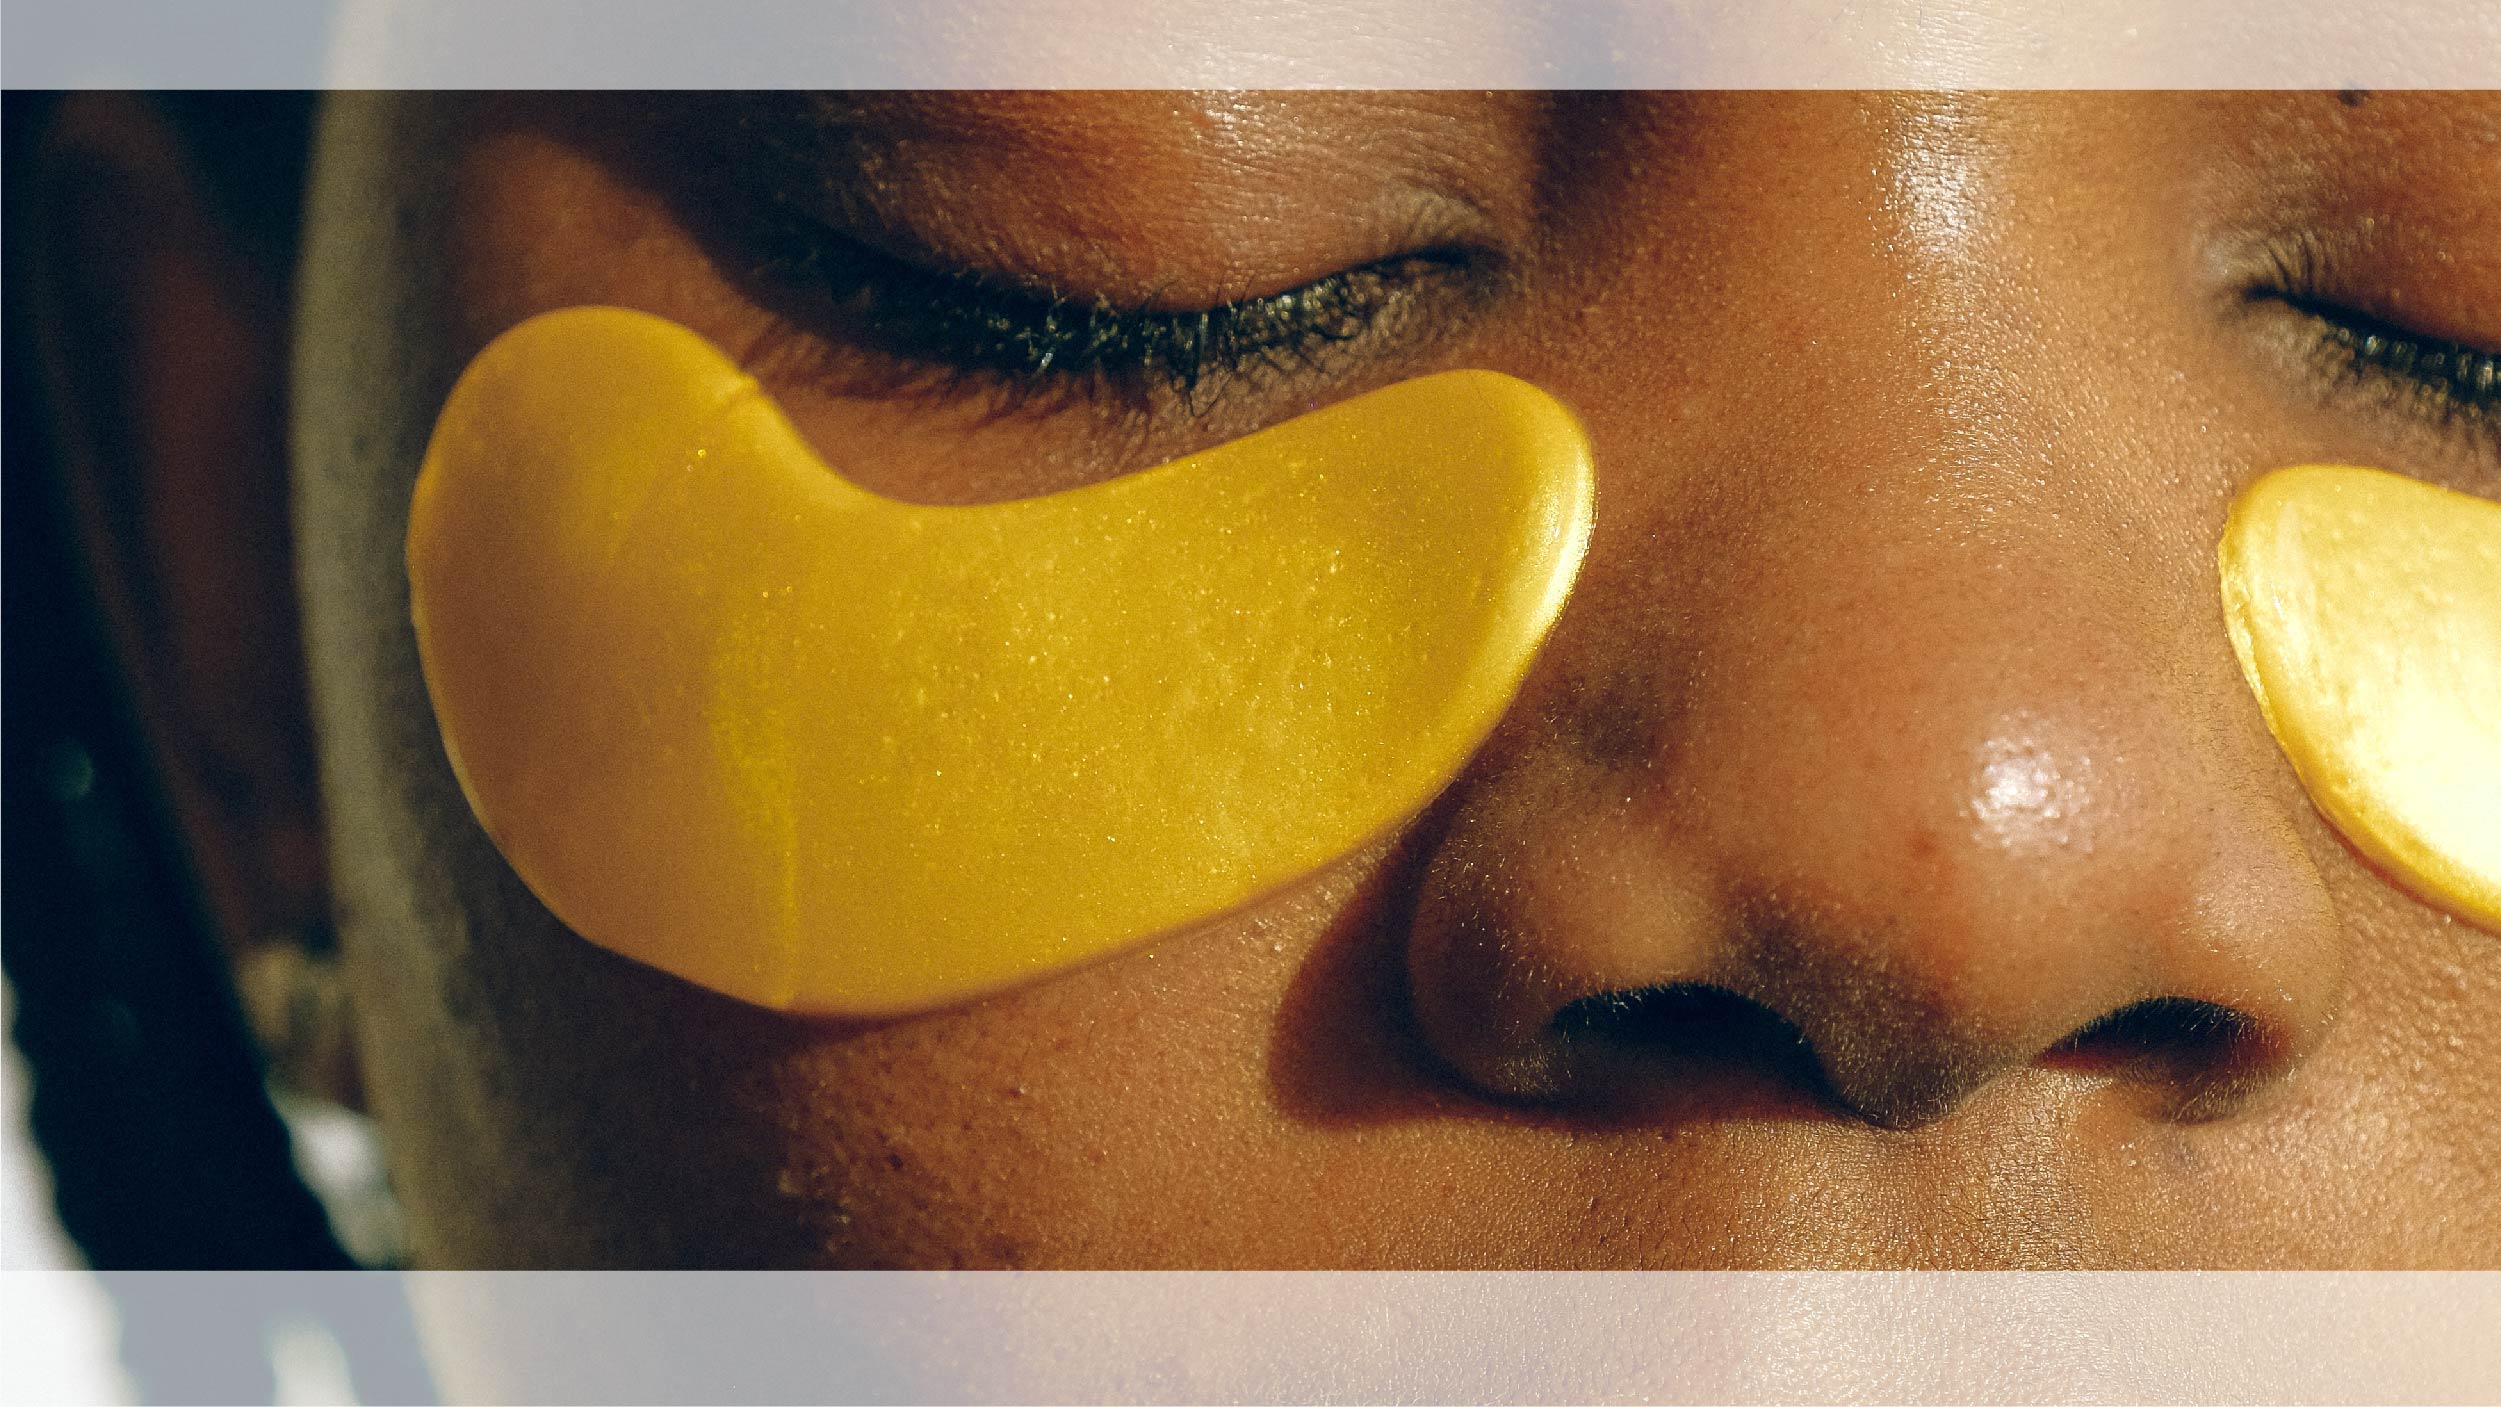
Organic rose hip oil has been my thing for the longest because it hydrates without breaking me out, all while treating my rosacea. I normally layer on a water-based emulsion afterwards like the Dr. Oracle A-Thera Emulsion before applying an oil-free SPF 35. Aside from drinking way more water than I was pre-pandemic, I also spritz water or rose hip water on my face throughout the day to keep it supple. My evening routine consists of a layer of rose hip oil followed by a super hydrating night mask like the Nature Skin Pot Sleeping Pack that’s filled with calming ingredients like hemp seed oil and pomegranate fruit extract. I also mask almost daily with a few of my favorites including the Gleamin Vitamin C Mask and the MediHeal Tea Tree Essential Blemish Control Sheet Mask. I slather manuka honey on my face several times a week for an extra kick of moisture. Overall, I really couldn’t be happier with my skin these days. And the truth is, I can’t imagine myself ever going back to daily makeup days again!