Struggling with dark patches? There’s different approaches to how to treat hyperpigmentation, but first you have to know exactly what hyperpigmentation is. Get your facts here.
As someone whose job is to write about skin care, I am often approached by both men and women for all kinds of skin-related advice. One of the most common questions I get is, “How do I treat my hyperpigmentation?” which is an issue that seems to be on the mind of many women who are in their late 20s or older.
To fully explore the topic of hyperpigmentation—from its causes to prevention to at-home and in-office treatments—I spoke to Sameer Bashey, a cosmetic dermatologist at the Obagi Skin Health Institute.
What exactly is hyperpigmentation?
First thing’s first, let’s define hyperpigmentation and learn about how it develops.
“Hyperpigmentation is the process by which the melanocyte, which is the pigment producing cell of the skin, begins to respond to internal and external stimuli that creates pigment,” explains Bashey. “Many times, skin pigmentation and skin discoloration is the response to some sort of damage or inflammatory process in the skin, such as a scratch, burn, resolving acne lesion, cosmetic procedure (such as laser resurfacing or chemical peel), or a healing wound.”
When hyperpigmentation is a result of an inflammatory process that has resolved, such as psoriasis, eczema, contact dermatitis, or acne, it is medically referred to as post-inflammatory hyperpigmentation.
“There are many other reasons for hyperpigmentation, but one of the most common is hyperpigmentation induced by sunlight,” Bashey adds. “Often times, this type of hyperpigmentation takes the shape of small lesions that are slightly darker than the surrounding skin tone.”
Race plays a big role in hyperpigmentation development
It’s true that some races are more likely to get hyperpigmentation than others.
“Generally speaking, Caucasians who do not have as active melanocytes as other skin tones do not have issues with hyperpigmentation,” says Bashey. “Hyperpigmentation largely affects pigmented skin tones, such as Asians, black people, Indians, Hispanics and Latinos, as well as populations from Southern Europe, North Africa, and parts of the Middle East. Because certain skin tones have active melanocytes, these active melanocytes are easily triggered by external and internal factors.”
Additionally, Eastern and Southeast Asian women are more prone to developing hyperpigmentation of the cheeks (and other parts of the face), a condition that’s called melasma. Melasma is also common for women, in general, during pregnancy. Speaking of women, we hate to be bad-news bearers, but those with double chromosomes are more likely to develop hyperpigmentation than men.
Preventing hyperpigmentation
Because hyperpigmentation is such a stubborn genetic, hormonal, sun, and gender-related condition of the skin, it can be a beast to prevent it. However, there are some effective steps you can take.
Regarding hyperpigmentation that’s caused by acne and skin inflammation, Bashey says it’s imperative to follow a comprehensive skin care regimen that controls the disease, strengthens your skin, and restores its natural health and barrier function. Regarding hyperpigmentation caused by the sun, religiously coating yourself in SPF, covering up, and avoiding extended sun exposure are crucial preventative measures.
As for melasma, Bashey says it’s a very difficult condition to prevent, as the triggering factors are largely genetic and hormonal. As mentioned, melasma is also more likely to affect pregnant women, and can also affect those who’ve just begun using birth control pills.
“We also know that this condition is worsened by sunlight,” noted Dr. Bashey. “It is difficult to prevent melasma, but general skincare and sun avoidance are the cornerstones of being prepared.”
Treating hyperpigmentation
There are a handful of over-the-counter ingredients that can help reduce hyperpigmentation, and hydroquinone is one the most powerful and effective. It works by essentially bleaching or fading the pigment, and ought to be used only as directed, ideally under the guidance of a dermatologist. (Do note that hydroquinone is not approved for pregnant women).
“There are other ingredients that also help to blend pigment rather than bleach it directly, such as Retin-A and retinol,” says Bashey. “Other agents can improve hyperpigmentation without using hydroquinone, but not to the same extent. These include kojic acid, glycolic acid, vitamin C, arbutin, niacinamide, and azelaic acid.”
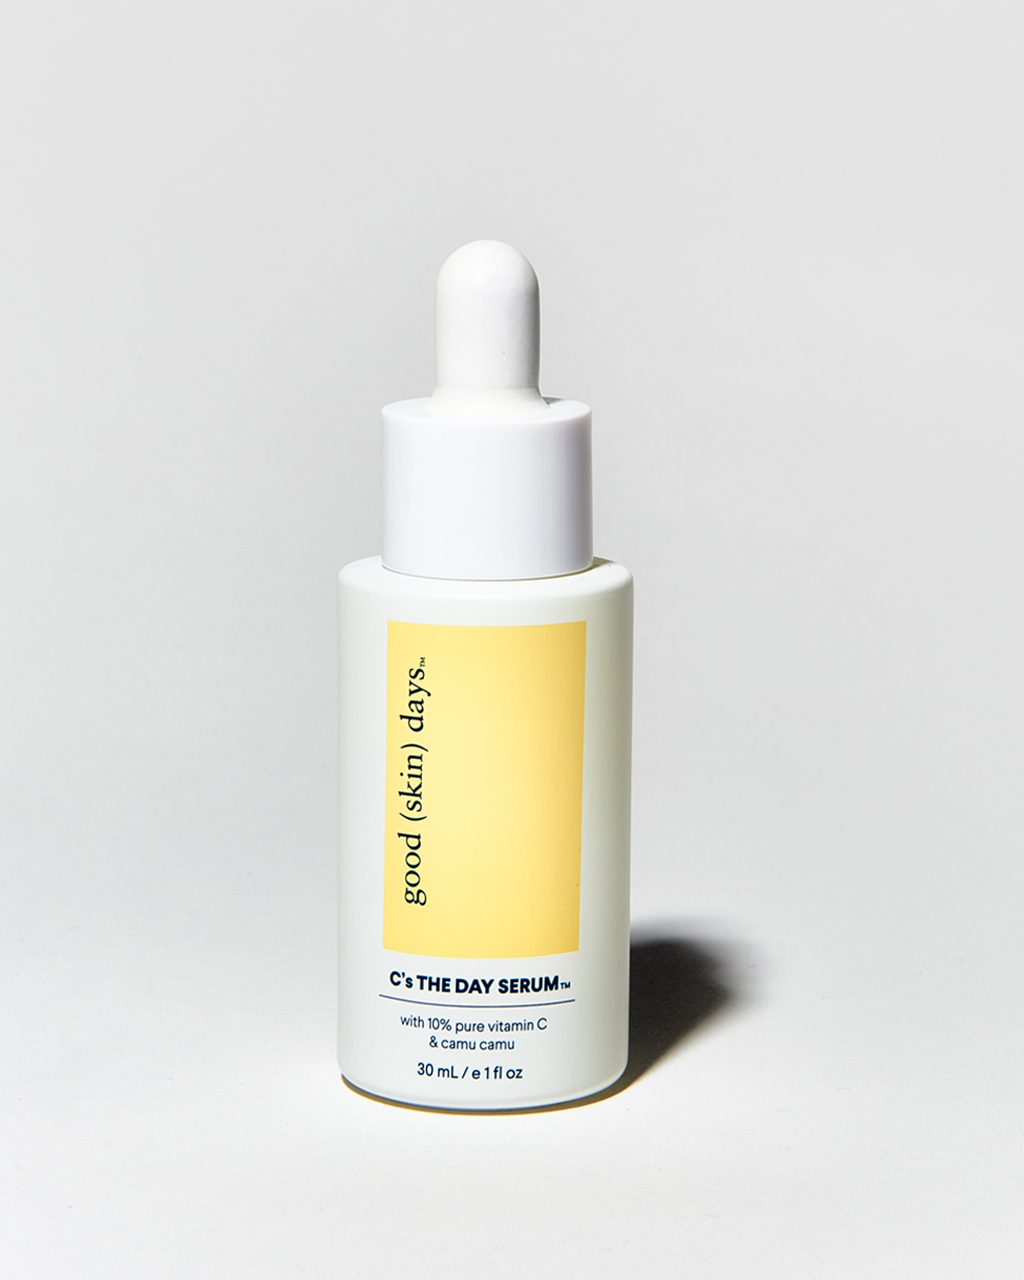
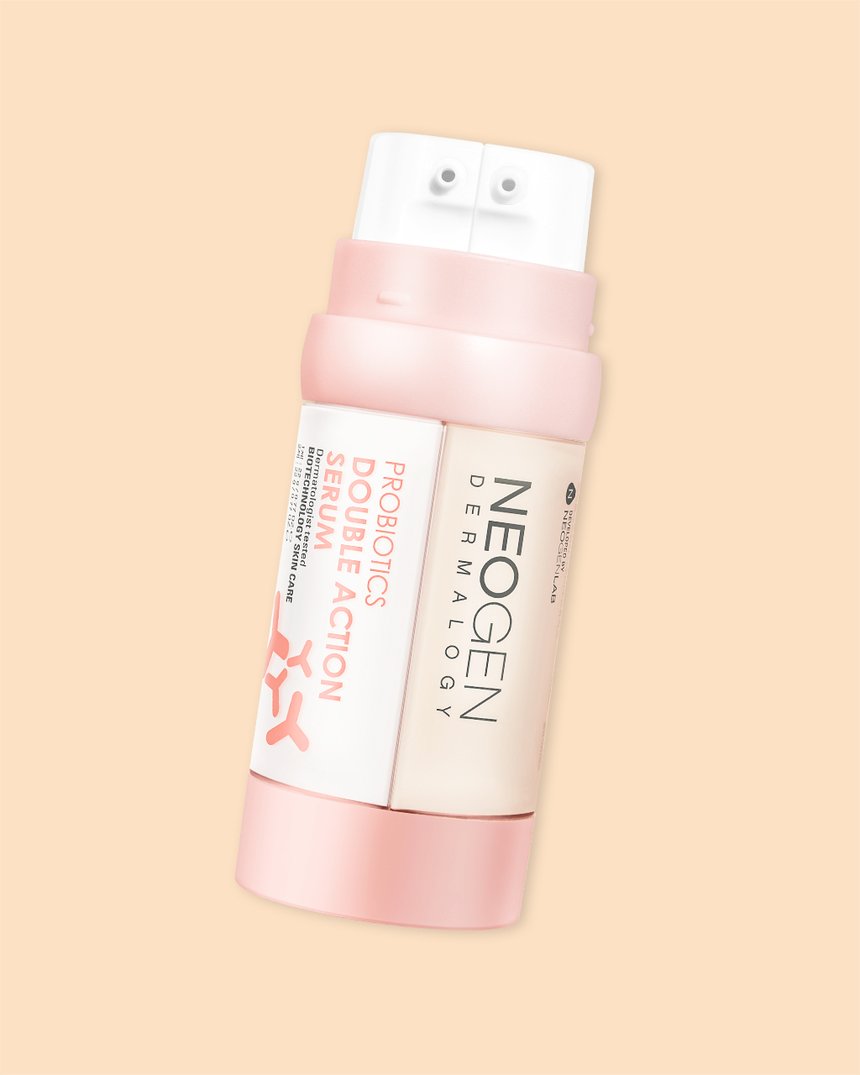
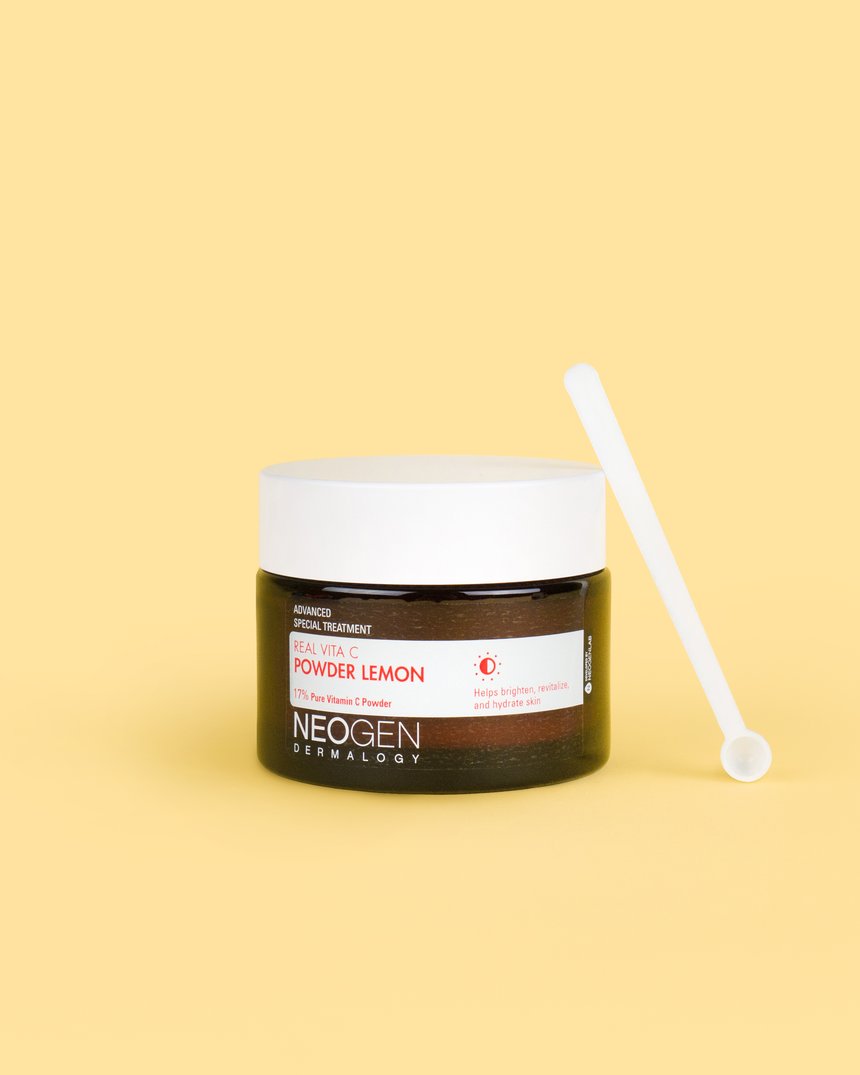
For at-home treatment, we recommend the Good (Skin) Days™ C’s The Day Serum, which has 10% pure vitamin C, the Neogen Probiotics Double Action Serum, which includes niacinamide to improve skin’s barrier, and the Neogen Real Vita C Powder Lemon, which is a powder form serum with 17% vitamin C.
Peels
“Some forms of hyperpigmentation are very intractable and do not resolve with cream programs alone, or with the prescription and over-the-counter medications mentioned above. Such type of hyperpigmentation requires the use of chemical peels,” says Bashey.
“When we are dealing with epidermal pigmentation, I often combine a comprehensive skin care program that includes hydroquinone with a series of superficial chemical peels,” he says. “For patients who cannot tolerate hydroquinone or are pregnant, I use non-hydroquinone based pigment control. For more stubborn pigment that is deeper in the skin, such as dermal melasma, we have had tremendous success utilizing the Control Depth Peel (AKA “The Zombie Peel”)—a TCA (trichloroacetic acid) based peel in which the depth of penetration is controlled by the operator.”
Of course, you can also temporarily cover hyperpigmentation with a cosmetic routine. We recommend using a primer, followed by a BB cream or other foundation, followed by a setting powder or spray to keep everything in place.
Bottom line:
In the end, try not to be too hard on yourself for something that is very common and very stubborn to prevent and treat. Do what you can to protect your skin via a comprehensive skin care regimen, a strict SPF routine, over-the-counter treatments, and when all else fails, cover up with makeup. If it’s something that bothers you, consider a more in-depth treatment administered by a professional.